

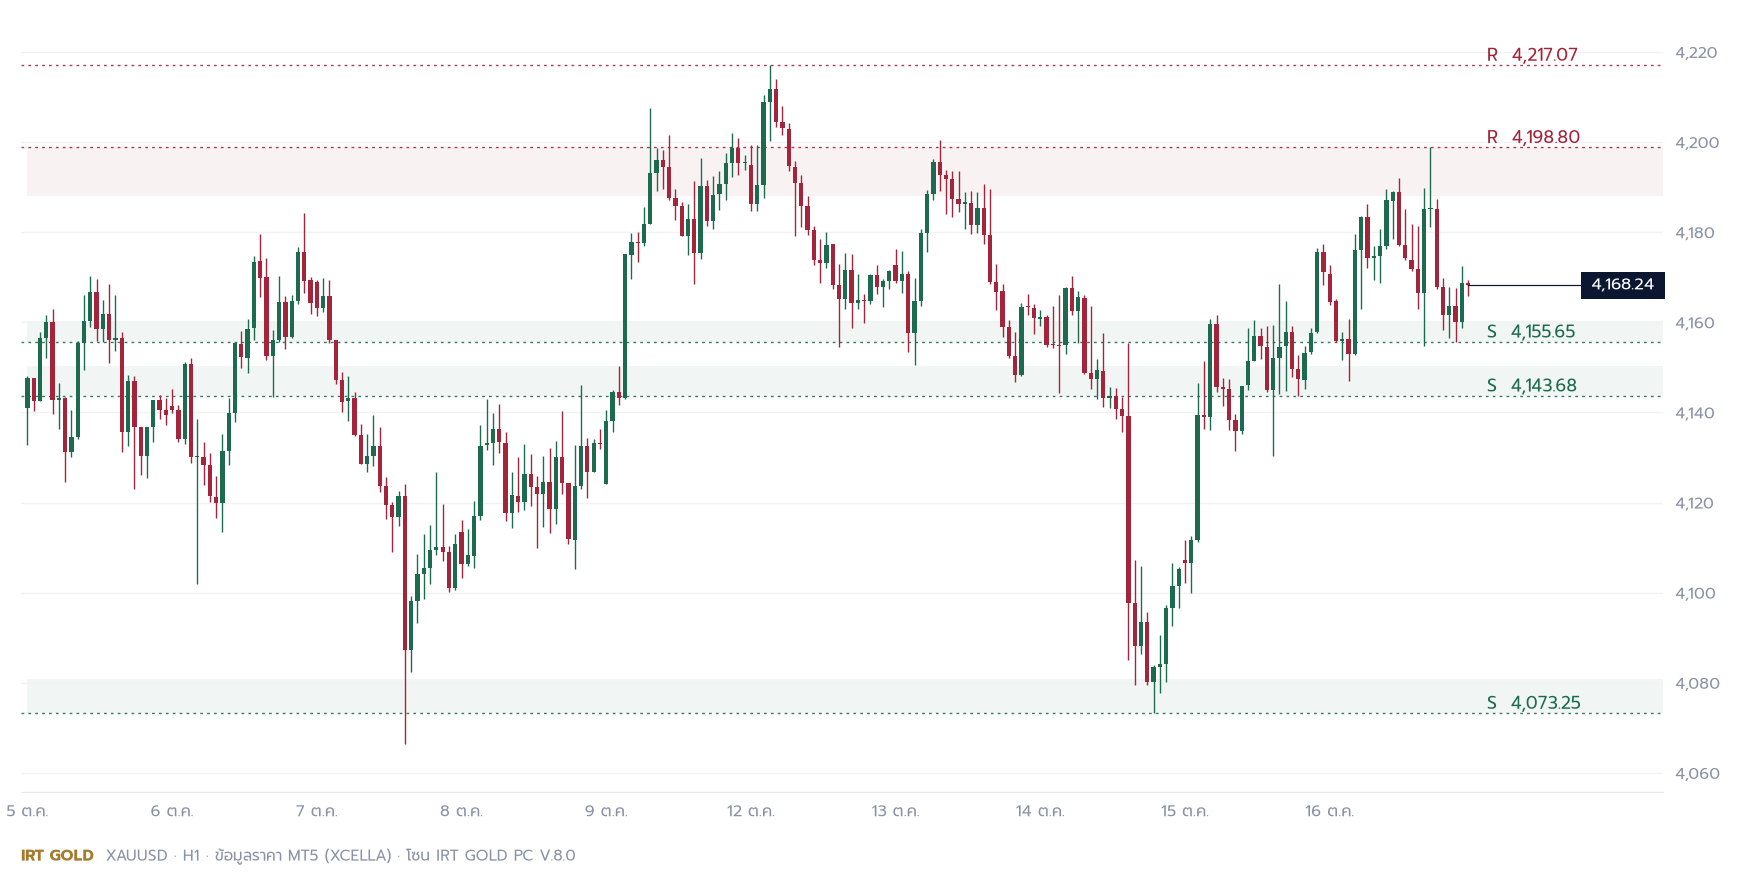
ราคาทองคำปิดวันศุกร์ที่ 16 ต.ค. ที่ 4,168.24 ดอลลาร์ เพิ่มขึ้น 12.35 ดอลลาร์ แต่ทั้งสัปดาห์ยังติดลบ 36.23 ดอลลาร์ ระหว่างสัปดาห์ราคาลงไปต่ำสุดที่ 4,073.25 ในวันพุธ ก่อนจะดีดกลับขึ้นมาเกือบ 100 ดอลลาร์ ภาพรวมจึงยังเป็นตลาดไซด์เวย์กรอบกว้าง จังหวะที่ได้เปรียบคือรอซื้อใกล้แนวรับและรอขายใกล้แนวต้าน มากกว่าการไล่ราคากลางกรอบGold closed Friday, Oct 16 at $4,168.24, up $12.35 on the day but still down $36.23 for the week. Midweek it dropped to a low of 4,073.25 on Wednesday before rebounding almost $100. The bigger picture is still a wide sideways range, so the edge lies in buying near support and selling near resistance rather than chasing price in the middle of the range.
| เปิดสัปดาห์ | สูงสุด | ต่ำสุด | ปิดสัปดาห์ | เปลี่ยนแปลง |
|---|---|---|---|---|
| 4,204.47 | 4,208.05 | 4,073.25 | 4,168.24 | −36.23 (−0.86%) |
ภาพรวมสัปดาห์ที่ผ่านมาLast week in review
สัปดาห์ที่แล้วมีข่าวสหรัฐออกถี่ ทั้งเงินเฟ้อ CPI ในวันที่ 14 ต.ค. ตามด้วย PPI และยอดค้าปลีกในวันที่ 15 ต.ค. รวมถึงการแถลงของประธาน Fed Warsh ทองตอบรับแรงที่สุดในวัน CPI ราคาแกว่งกว้างถึง 97 ดอลลาร์ในวันเดียวและลงไปทำจุดต่ำสุดของสัปดาห์ จากนั้นค่อย ๆ ฟื้นตัวสองวันติด ขึ้นไปแตะ 4,198.80 ในวันศุกร์ แต่ถูกขายกลับลงมาปิดที่ 4,168Last week was packed with US data: CPI inflation on Oct 14, then PPI and retail sales on Oct 15, plus a speech by Fed Chair Warsh. Gold reacted most on CPI day, swinging $97 in a single session and printing the weekly low. It then recovered for two straight days, touched 4,198.80 on Friday and was sold back down to close at 4,168.
สิบวันทำการล่าสุดทองแกว่งเฉลี่ยวันละราว 67 ดอลลาร์ ถือว่าผันผวนสูง ใครที่ถือออเดอร์ข้ามช่วงข่าวควรวาง SL ให้พ้นระยะแกว่งปกติ และลดขนาด Lot ลงให้สอดคล้องกันOver the last ten trading days gold has moved about $67 a day on average. That is high volatility: anyone holding positions through news should place stops beyond the normal swing and reduce lot size accordingly.
มุมมองทางเทคนิคTechnical view
บนกราฟ 4 ชั่วโมง ราคากลับขึ้นมายืนเหนือเส้นค่าเฉลี่ย EMA 50 ที่ 4,162.56 ได้แล้ว แต่ยังอยู่ใต้ EMA 200 ที่ 4,233.65 แปลว่าระยะสั้นฟื้นตัวจริง แต่ระยะกลางยังไม่กลับเป็นขาขึ้น นับตั้งแต่ต้นเดือนกันยายนที่ราคาเคยอยู่เหนือ 4,400 ทองยังทำจุดสูงสุดต่ำลงเรื่อย ๆOn the 4-hour chart price is back above the 50 EMA at 4,162.56 but still below the 200 EMA at 4,233.65. The short-term recovery is real, but the medium-term trend has not turned up. Since early September, when gold traded above 4,400, it has kept making lower highs.
บนกราฟ 1 ชั่วโมง EMA 50 กับ EMA 200 แทบจะซ้อนทับกัน (4,161.65 และ 4,162.13) เป็นภาพของตลาดที่ยังหาทิศทางไม่เจอ สอดคล้องกับมุมมองไซด์เวย์On the 1-hour chart the 50 and 200 EMAs are almost on top of each other (4,161.65 and 4,162.13), the picture of a market without direction, consistent with the sideways view.
โซนจาก IRT GOLD PC V.8.0 แสดงโซนขาย (Supply) ที่ 4,188 ถึง 4,199 ซึ่งราคาเพิ่งถูกขายกลับลงมาเมื่อวันศุกร์ และมีโซนซื้อ (Demand) ซ้อนกันสามชั้นด้านล่าง ที่ 4,156 ถึง 4,160, 4,144 ถึง 4,150 และ 4,073 ถึง 4,081IRT GOLD PC V.8.0 shows a supply zone at 4,188 to 4,199, where price was sold on Friday, and three stacked demand zones below at 4,156 to 4,160, 4,144 to 4,150 and 4,073 to 4,081.
ระดับราคาสำคัญ
| แนวต้าน 1 | 4,217.07 | High สัปดาห์ก่อน (12 ต.ค.)Previous week's high (Oct 12) |
|---|---|---|
| แนวต้าน 2 | 4,198.80 | High วันศุกร์ และ โซน Supply ของ V.8.0 (4,188 ถึง 4,199)Friday's high and the V.8.0 supply zone (4,188 to 4,199) |
| แนวรับ 1 | 4,155.65 | โซน Demand ใกล้สุด (4,156 ถึง 4,160)Nearest demand zone (4,156 to 4,160) |
| แนวรับ 2 | 4,143.68 | โซน Demand ถัดไป (4,144 ถึง 4,150)Next demand zone (4,144 to 4,150) |
| แนวรับ 3 | 4,073.25 | Low สัปดาห์ (14 ต.ค.) และ โซน Demand ใหญ่ (4,073 ถึง 4,081)Weekly low (Oct 14) and major demand zone (4,073 to 4,081) |
แผนการเทรด
| ขาขึ้น | ถ้าแท่ง 1 ชั่วโมงปิดยืนเหนือ 4,199 ได้If a 1-hour candle closes above 4,199ทางขึ้นเปิดไปทดสอบ 4,217 ซึ่งเป็นจุดสูงสุดของสัปดาห์ก่อน และเป็นจุดที่ Indicator Trend UP ของเราจะออกสัญญาณซื้อthe way opens to test 4,217, last week's high, and our Trend UP indicator would trigger a buy. |
|---|---|
| ในกรอบ | ถ้าราคายังอยู่ระหว่าง 4,144 ถึง 4,199If price stays between 4,144 and 4,199เล่นในกรอบ ซื้อใกล้โซน 4,144 ถึง 4,160 และขายใกล้โซน 4,188 ถึง 4,199 หลีกเลี่ยงการเข้ากลางกรอบtrade the range: buy near 4,144 to 4,160, sell near 4,188 to 4,199, and avoid entries in the middle. |
| ขาลง | ถ้าราคาขึ้นไปเหนือ 4,199 แล้วปิดกลับลงมาด้วยแท่งแดง หรือหลุด 4,143If price pokes above 4,199 and closes back below with a red candle, or breaks 4,143แรงขายกลับมา เป้าหมายถัดไปคือ 4,073 ถึง 4,081 และเป็นจังหวะที่ Indicator Bear Sweep ของเราจะออกสัญญาณขายsellers are back, the next target is 4,073 to 4,081, and our Bear Sweep indicator would trigger a sell. |
สถานะ Indicator ของ IRT GOLDIRT GOLD indicator status
| #1 UP | Trend UPผ่านแล้ว 2 จาก 5 เงื่อนไข เทรนด์ H4 และ M15 เป็นขาขึ้น เหลือรอราคาปิดทะลุ 4,198.802 of 5 conditions met: H4 and M15 trends are up, waiting for a close above 4,198.80 |
|---|---|
| #2.2 BS | Bear Sweepผ่านแล้ว 2 จาก 4 เงื่อนไข เทรนด์ใหญ่ยังทำจุดสูงสุดต่ำลง รอราคาขึ้นไปกวาด 4,198.80 แล้วปิดกลับลง2 of 4 conditions met: the larger trend is still making lower highs, waiting for a sweep of 4,198.80 and a close back below |
| #3.1 / #3.2 | Sideway Box และ Asia Breakรอกรอบราคาช่วงเอเชียของวันจันทร์ (05:00 ถึง 09:00 น.)Waiting for Monday's Asian range (05:00 to 09:00 Thai time) |
สิ่งที่ต้องติดตาม
- ระดับ 4,199 ทั้งฝั่งซื้อและฝั่งขายของระบบเรารอสัญญาณที่ราคานี้4,199: both the buy and sell sides of our system are waiting for a signal at this level
- ปฏิทินข่าวสหรัฐของสัปดาห์นี้ จะอัปเดตอีกครั้งเช้าวันจันทร์เมื่อตารางข่าวออกThis week's US news calendar will be added on Monday morning once it is published
- ความผันผวนเฉลี่ยวันละราว 67 ดอลลาร์ วาง SL ให้พ้นระยะแกว่งปกติAverage daily range of about $67: keep stops beyond the normal swing
ที่มาข้อมูล: ราคาจาก MT5 (XCELLA PRIME, XAUUSD) โซนจาก IRT GOLD PC V.8.0 และสถานะ Indicator จาก IRT GOLD AI Dashboard ณ ราคาปิดวันที่ 16 ต.ค. 2569Sources: Prices from MT5 (XCELLA PRIME, XAUUSD), zones from IRT GOLD PC V.8.0 and indicator status from the IRT GOLD AI Dashboard, as of the Oct 16, 2026 close